FRENCKEN GROUP LIMITED
ANNUAL REPORT 2014
08
FINANCIAL SUMMARY
(1)
Operating profit represents profit before interest, tax and exceptional items
(2)
This represents the difference between the average market capitalisation and average shareholders’ equity for the year
FINANCIAL YEAR
FY DEC
FY DEC
FY DEC
FY DEC
FY DEC
2010
2011
2012
2013
2014
Operating Results
$'000
$'000
$'000
$'000
$'000
Revenue
351,796
335,547
360,957
444,737
472,737
Operating profit
(1)
22,478
12,091
1,431
24,866
17,806
Profit/(Loss) attributable to equity holders
17,552
7,341
(11,810)
17,744
11,358
Financial Position
$'000
$'000
$'000
$'000
$'000
Total assets
283,640
282,489
355,779
335,095
352,262
Total liabilities
87,350
86,127
167,773
128,030
143,807
Shareholders' equity
196,290
196,362
186,842
205,282
206,916
Key Ratios
Net profit/(loss) on turnover (%)
5.0
2.2
(3.3)
4.0
2.4
Return on average equity (%)
9.0
3.7
(6.2)
9.1
5.5
Net (cash)/debts to equity (%)
(17.1)
(7.6)
20.5
15.4
17.7
Earnings/(Loss) per share - basic (cents)
4.7
2.0
(3.2)
4.5
2.8
- diluted (cents)
4.7
2.0
(3.2)
4.4
2.8
Net assets value per share (cents)
53.6
53.3
47.1
51.5
51.2
Dividend per share (cents)
1.44
0.61
0.50
1.40
1.00
Share Price and Market Capitalisation
Cents
Cents
Cents
Cents
Cents
Highest
35.0
35.0
26.0
28.0
39.0
Lowest
20.5
24.0
18.5
19.1
21.5
Average
26.6
28.5
22.0
22.2
32.0
$'000
$'000
$'000
$'000
$'000
Average market capitalisation
97,345
104,932
87,185
88,415
129,431
Average shareholders' equity
195,789
196,326
191,602
196,062
206,099
Market value differential
(2)
(98,444)
(91,394)
(104,417)
(107,647)
(76,668)
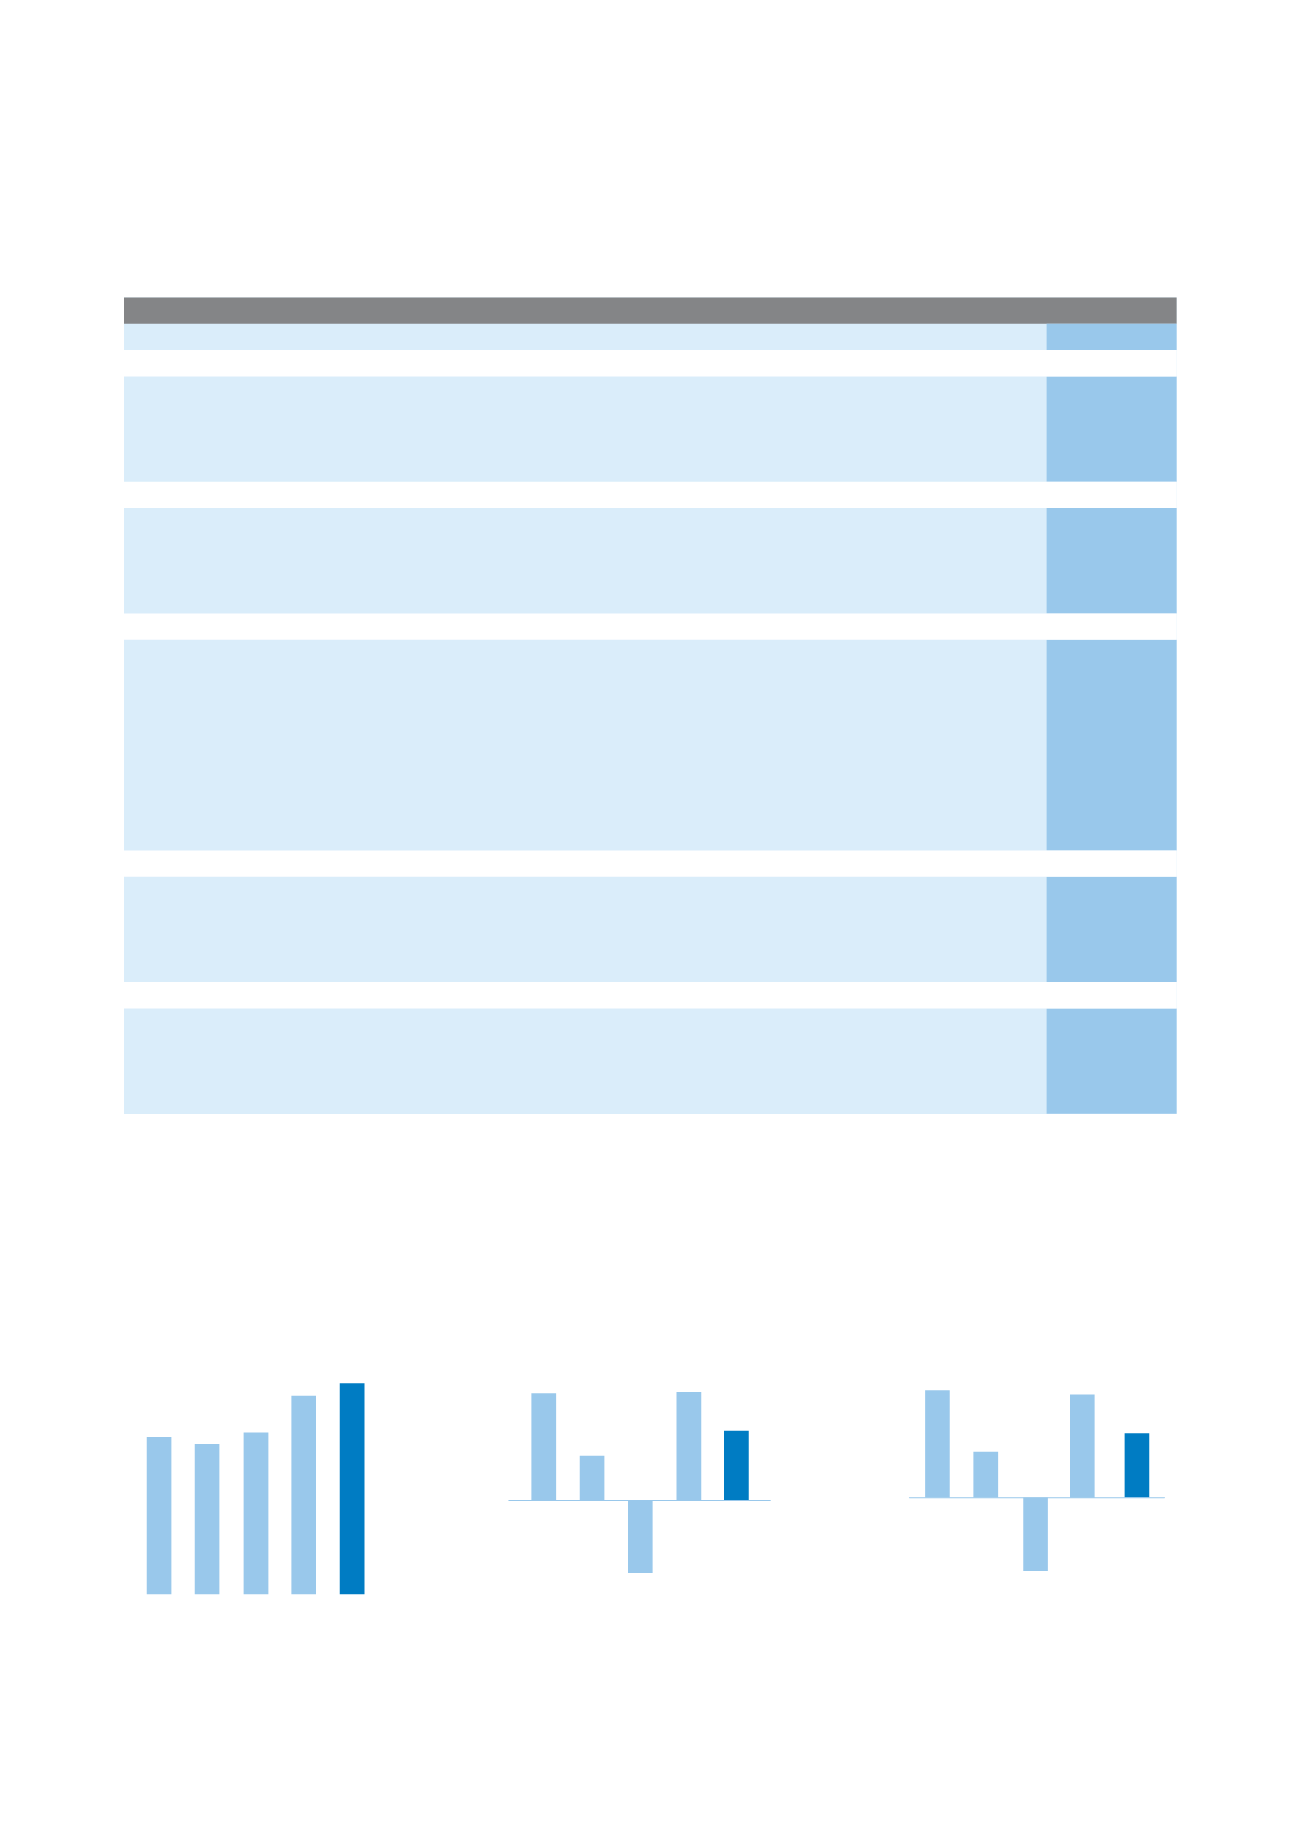
Revenue ($’000)
Profit/(Loss) attributable to
equity holders ($’000)
Earnings/(Loss) per share -
basic (cents)
2010 2011
2013
2012
2014
472,737
351,796
360,957
335,547
444,737
2010 2011
2013
2012
2014
11,358
17,744
17,552
7,341
(11,810)
2010 2011
2013
2012
2014
4.7
(3.2)
2.0
2.8
4.5


