11
FRENCKEN GROUP LIMITED
ANNUAL REPORT 2014
BUSINESS REVIEW
(CONT’D)
For FY2014, the Group reported a 36.0%decline in net profit
attributable to equity holders to S$11.4 million, compared
to S$17.7 million in FY2013. This was due mainly to lower
gross profit, recognition of non-cash exceptional charges of
S$0.7 million, and the absence of foreign exchange gain of
S$2.2 million that was recognised for FY2013.
As at 31 December 2014, the Group had shareholders’
equity of S$206.9 million. This is equivalent to net asset
value of 51.2 cents per share, based on the total number of
issued shares of 404.5 million shares.
Total assets as at 31 December 2014 increased to S$352.3
million from S$335.1 million at the end of December
2013, attributed mainly to increases in intangible assets,
inventories, and trade receivables. Intangible assets
increased to S$24.9 million from S$19.7 million as at 31
December 2013, attributable mainly to goodwill arising
from the acquisition of NTZ and development costs incurred
for on-going projects at the Europe operations.
Inventories increased to S$95.7 million from S$85.9 million
at the end of FY2013 for fulfillment of customers’ orders
and higher stock of finished goods held for automotive
customers. Trade receivables increased to S$87.2 million,
from S$83.0 million as at 31 December 2013, due to higher
sales in the fourth quarter of FY2014 as compared to the
same period in FY2013.
Total liabilities increased to S$143.8 million as at 31 December
2014 from S$128.0 million at the end of FY2013, attributable
mainly to increases in trade and other payables, and bank
borrowings. Trade payables increased to S$49.1 million from
S$40.5million as at 31 December 2013, in tandemwith higher
purchases of materials required to fulfill customers’ orders. As
at 31 December 2014, the Group had net bank borrowings
of S$36.6 million, compared to S$31.6 million at the end of
FY2013. Accordingly, the Group’s net debt-to-equity ratio
increased to 17.7% from 15.4% as at 31 December 2013.
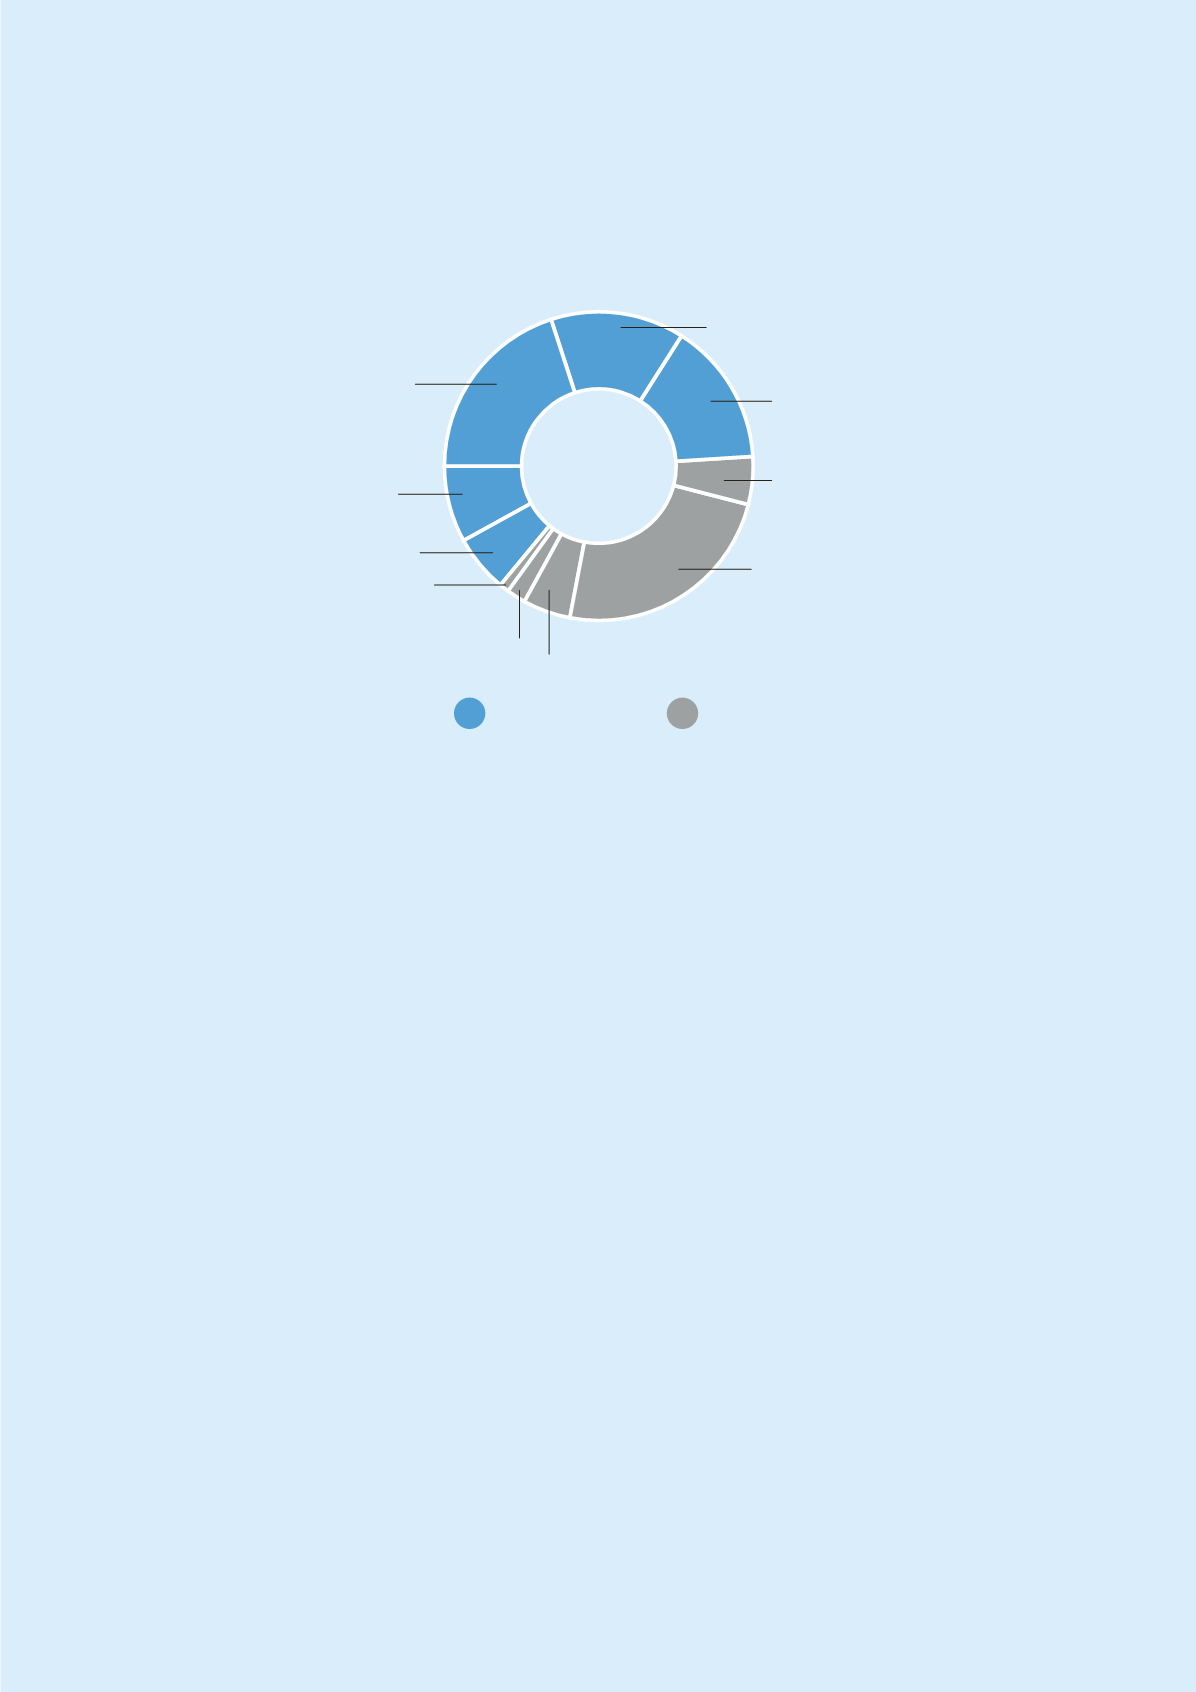
Revenue breakdown by business segment
Mechatronics
IMS
Analytical (20%)
Semiconductor (15%)
Office Automation (5%)
Others (1%)
Automotive (24%)
Industrial Automation (8%)
Medical (14%)
Tooling (2%)
Consumer & Industrial Electronics (5%)
Others (6%)


